Skip to content
AZCİS

Services

GIS — Geographic Information Systems

Collection, storage, analysis and cartographic visualisation of spatial data.

Geographic Information Systems (GIS) are systems for the collection, storage, analysis and graphical visualisation of spatial (geographic) data and of the information about the objects connected to it.

GIS provides for the collection, processing, storage, preparation, cartographic presentation and distribution of data related to any location. As the most suitable instrument for solving scientific, educational and practical problems involving geographic data, GIS adoption is growing very rapidly in the modern information society.

One of the company’s principal aims is the creation and implementation of GIS, the delivery of GIS training for our clients’ experts, and the provision of technical support services.

PROCESS

From spatial data to a decision

The five stages are taken from AZCİS’s own definition of GIS: collection, storage, analysis, graphical visualisation, and the solving of problems. The plan shown is a real company drawing — Qazıqumlaq village, Ucar district — and each stage opens its own layers.

  1. 01

    Collecting the data

    STAGE01 / 05

    1:50000/6 LAYERS

    Qazıqumlaq village, Ucar district — AZCİS project drawing
    N
    1:5000
    • Green areas
    • Structures
    • 0.4 kV network
    • 10 kV overhead line
    • KTM points
    • Metering points

    Spatial data is gathered in the field: GPS and Total Station measurement, (x, y, z) coordinates fixed to high precision by connecting to the AzPOS base system, and drone photography where the terrain is hard to access.

  2. 02

    Structuring the data

    STAGE02 / 05

    1:50002/6 LAYERS

    Qazıqumlaq village, Ucar district — AZCİS project drawing
    N
    1:5000
    • Green areas
    • Structures
    • 0.4 kV network
    • 10 kV overhead line
    • KTM points
    • Metering points

    The collected data is stored, processed and separated into layers — each class of object in its own layer. Structures and green areas form the base of the plan.

  3. 03

    Spatial analysis

    STAGE03 / 05

    1:50004/6 LAYERS

    Qazıqumlaq village, Ucar district — AZCİS project drawing
    N
    1:5000
    • Green areas
    • Structures
    • 0.4 kV network
    • 10 kV overhead line
    • KTM points
    • Metering points

    With the layers superimposed, the spatial relationships become readable: the branching of the 0.4 kV network and the route of the 10 kV overhead line are read together with the terrain itself.

  4. 04

    Visualisation

    STAGE04 / 05

    1:50006/6 LAYERS

    Qazıqumlaq village, Ucar district — AZCİS project drawing
    N
    1:5000
    • Green areas
    • Structures
    • 0.4 kV network
    • 10 kV overhead line
    • KTM points
    • Metering points

    The result becomes a cartographic presentation: KTM points and metering points, drawn with the legend’s own symbols, come together with the scale and sheet grid into a readable plan.

  5. 05

    Making the decision

    STAGE05 / 05

    1:50006/6 LAYERS

    Qazıqumlaq village, Ucar district — AZCİS project drawing
    N
    1:5000
    • Green areas
    • Structures
    • 0.4 kV network
    • 10 kV overhead line
    • KTM points
    • Metering points

    The finished plan becomes the basis for design, construction and operational decisions. GIS is the most suitable instrument for solving scientific, educational and practical problems involving geographic data.

Source: AZCİS project drawing, 1:5000. The layers are separated out of the drawing itself by colour.

Application areas

Areas where GIS is applied

Urban and regional planning

01

Urban and regional planning

The core components of urban and regional planning are the assessment of demand in water supply and sewerage networks, the design of engineering networks, monitoring the condition of those networks and preventing failures, and urban development and design.

Every day planners use Geographic Information System technology to study, develop, implement and track the progress of their plans. GIS equips planners, researchers and engineers with the tools they need to design and map their neighbourhoods and cities. Planners hold the technical experience, political judgement and financial understanding to turn a vision of tomorrow into a strategic action plan for today, and they use GIS to make the decision-making process easier.

Desertification is the degradation of land as a result of climate change or human activity. GIS can provide information about degraded land that can then be managed by state institutions or by communities themselves. GIS plays an important role in reducing desertification, and local governments now depend heavily on GIS for it. With ground-based GIS analysis we can find where and which areas are suitable for planting new vegetation, and which areas are suitable for laying a pipeline.

GIS technology is used to analyse urban growth and the direction of its expansion, and to find suitable locations for future urban development. Certain factors have to be taken into account when identifying suitable areas: the land must have the necessary accessibility, it must be more or less flat, it must be vacant or currently of low use value, and there must be good supply infrastructure. GIS has many uses and advantages in facility management — facility managers can use it for spatial management, visualisation and planning. It can be used for everything from deciding where facilities will be built to planning the space itself.

Economic development

02

Economic development

In any field, a Geographic Information System first consolidates the legal and regulatory framework. GIS programmes provide a detailed analysis of all the social, economic and topographic characteristics that affect the economy of a given field.

One of the core components of GIS is analysing economic assessment in the most effective form on the basis of mathematical and statistical indicators. Where a successful economic assessment must be carried out in a given field, the existing legal and regulatory framework is analysed, and only the necessary updates arising in that framework as a result of the assessment are converted into data. With the technical capabilities of GIS, mathematical calculations are performed on the basis of that necessary data and a complete plan is prepared that makes economic success achievable. This is the contribution GIS makes to economic development.

As an example, we can point to specific fields where GIS-based economic assessment can contribute positively to the state’s economic capacity. A Geographic Information System analyses agricultural land, studies its designation, fertile layer and quality, and provides the state with the necessary recommendations on which agricultural product can best be grown in that area.

On the economic side, GIS services can also be drawn on in the creation of industrial zones. Through economic assessment, GIS can give recommendations for simplifying logistics within industrial zones. Establishing new logistics centres in those zones on the basis of such recommendations reduces costs and has a positive effect on the progress of economic development.

In short, the contribution of GIS to the economy as a whole is to create the data behind the information, to carry out economic assessment, and to give advantageous recommendations by eliminating the contradictions between the legal framework and real indicators.

Emergencies and natural disaster response

03

Emergencies and natural disaster response

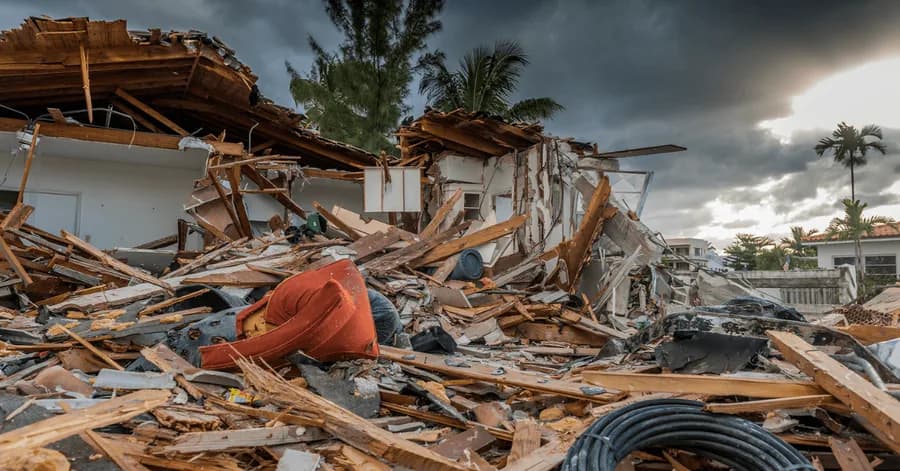
The main directions here are monitoring and assessing the condition of the natural environment, modelling ecological disasters and analysing their consequences, and planning nature-protection measures.

Well-developed GIS systems are used today to protect the environment. GIS has become an integrated, well-established and successful tool in disaster management and mitigation. By showing the areas prone to natural or man-made disasters, GIS can assist in risk management and analysis. Once such hazards are identified, preventive measures can be prepared.

Landslide hazard-zone assessment using GIS: landslide hazard zoning is the process of ranking different parts of a territory according to the actual or potential degree of danger from landslides. It has become possible to efficiently gather, manipulate and integrate the varied spatial data usable for a hazard zone — such as the geological, structural, surface-cover and slope characteristics of the territory. All of these layers can be well integrated using GIS, which is useful for finding landslide-prone terrain. With GIS we can carry out risk assessment and reduce the loss of life and property.

Where required, GIS helps document the need for disaster relief funds during emergencies, and is used by insurance agencies to help assess property loss and its monetary value. Local government bodies can estimate damage by mapping flood-risk areas in order to assess the potential level of flooding in the surroundings.

Volcanic hazards to human life and the environment include gas clouds of hot particles, lava flows and floods. A potential volcanic hazard zone is identified through the characteristic historical record of volcanic activity, and these can be combined with GIS. GIS-based platforms therefore allow us to identify the damage when assessing volcanic impact on economic, human and property losses in densely populated areas.

Law enforcement and security agencies

04

Law enforcement and security agencies

In this area GIS addresses the planning of rescue operations and protective measures, the modelling of emergencies, strategic and tactical planning of operations, and the navigation of rapid-response services and other security bodies.

GIS can be used to assess how far each part of the street network is from a fire station. This can be useful for evaluating the best site for a new fire station, or for determining how well the service areas of existing stations provide coverage.

Regular terrain analysis is essential for today’s fast-moving field conditions. The traditional method of studying paper topographic maps is being replaced by the use of maps in digital form to obtain information about terrain. Digital imagery is increasingly used to derive terrain data. This helps in selecting suitable positions more accurately and more quickly for a range of purposes.

GIS is an essential instrument for crime mapping in law enforcement agencies worldwide. Crime mapping is a core component of crime analysis. Satellite imagery can reveal important information about criminal activity. The efficiency and speed of GIS analysis increases the capacity to combat crime.

Oil and gas industry

05

Oil and gas industry

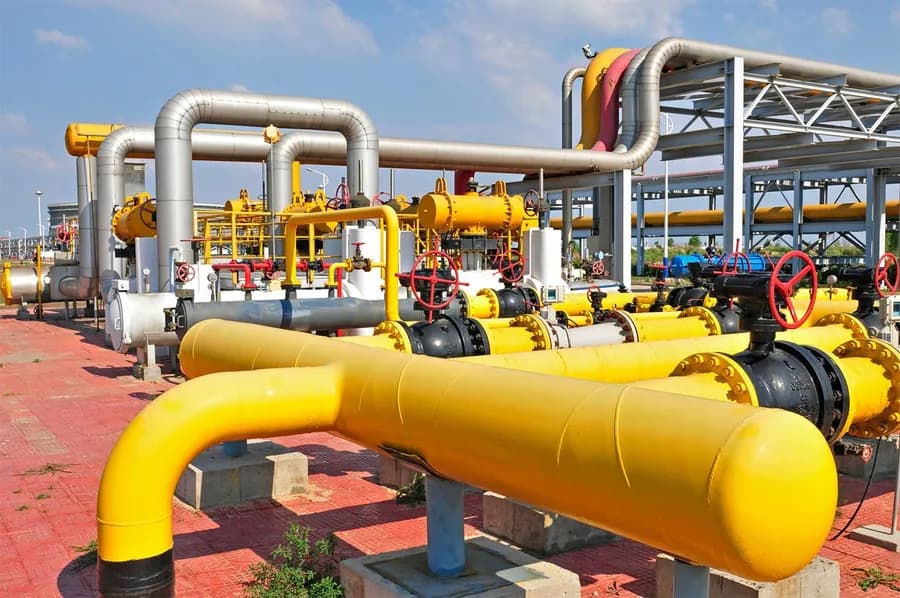
In this service area GIS mainly delivers geological exploration, monitoring of the technological operating regimes of oil and gas pipelines, the design of trunk pipelines and similar processes.

The location of a pipeline and cable is essential for detecting a leak or any damage. It can be used to understand your water network, carry out repairs and adjustments, find a known distance for correlation, and so on. With GIS-based technologies pipelines are monitored continuously, leak hazards are detected and the problem is prevented.

Where oil and gas companies hold reliable oil-and-gas GIS and a GIS data package for the gas pipeline, they obtain sufficient information about increasing the output of pipelines, equipment and gas infrastructure. Using GIS data they can identify the particular geographic conditions affecting the production process, as well as ecological factors. Using GIS and remote sensing technologies they can take appropriate decisions on environmental protection and develop the business without creating danger to people or their property.

Roads, highways and transport

06

Roads, highways and transport

Management of transport infrastructure and its development, fleet management and logistics, route optimisation and analysis of freight flows.

GIS is used in managing transport and logistics problems. If a transport department is planning a new rail or road route, this can be done by adding environmental and topographic data to a GIS platform. Based on criteria such as the most correct route, the least damage to the living environment and the least disturbance to the local population, the best route for transport can easily be derived.

GIS is also used effectively in monitoring railway systems and road conditions, and for managing transport problems. Today the population is growing exponentially along with road traffic. By creating an extensive database holding all transport data — speed data, road geometry, traffic flow and other spatial data — and by processing that data, we obtain a comprehensive graphical picture for transport management.

GIS can be used as a principal instrument for minimising accident risk on roads; the existing road network must be optimised and road-safety measures likewise improved. This can be achieved through correct transport management.

Let us put your project on the map.

Get in touch with the AZCİS team about your infrastructure, engineering or geospatial project.